Word Cloud is a visualization technique that works for showing the most important thematic words in harmony from a group of words within a context. Word Clouds can be used to show the most important terms from the customer reviews or contents of the customers. Word Clouds Comparison may help to detect the differences for third-party metrics that are related to the words. For instance, in a word cloud, the size of a word can be changed according to the search volume of the word in a search engine or occurrence frequency in a document.
In this article, we will focus on benefits of word clouds and their creation methodologies with Python.
What are the Necessary Python Libraries and Packages for Creating Word Clouds?
To create a word cloud in Python, there is a specific library called “WordCloud”. WordCloud Python Library is solely focused on creating word clouds from the words that are given. Along with Word Cloud, we will use “numpy”, “pandas”, “matplotlib”, “pillow”. You may see the names of the necessary libraries to create a word cloud in Python and their functions below.
- WordCloud is for creating word clouds with Python.
- Pandas is for extracting data and words from a group of information.
- Numpy is for changing the shape of the word cloud.
- Pillow is for taking images for creating word clouds.
- Matplotlib is for creating plots for the gathered data with Pandas.
Importing Necessary Python Libraries for Creating Word Clouds
To begin our tutorial, we need to import the necessary libraries as below.
import numpy as np
import pandas as pd
from os import path
from PIL import Image
from wordcloud import WordCloud, STOPWORDS, ImageColorGenerator

import matplotlib.pyplot as plt
% matplotlib inline
We will perform our Word Cloud visualization via Python through Netflix Movies Title Data Frame.
df = pd.read_csv("netflix_titles.csv")
OUTPUT>>>
df
You may see the view of the data frame below.
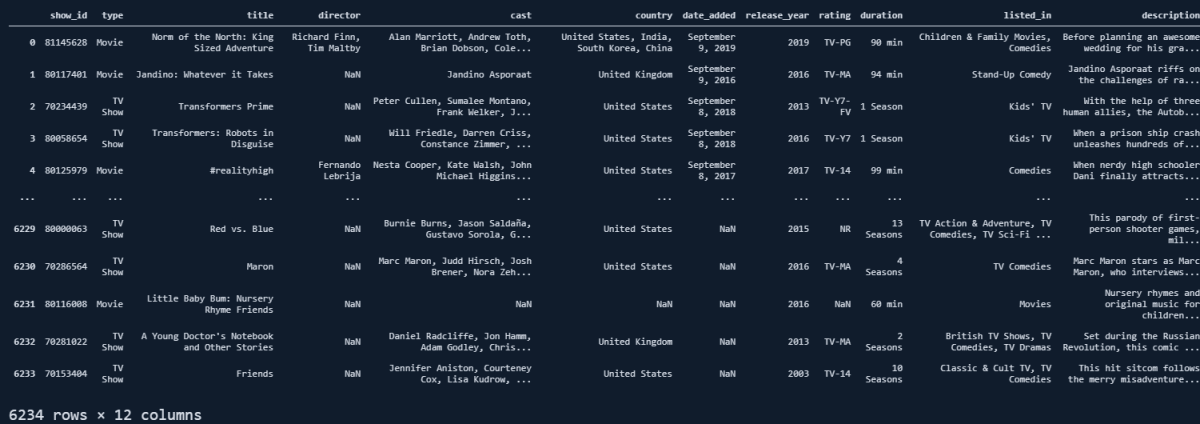
We have 6234 Movies with 12 different columns. We have actor and actress names, countries, release years, ratings, durations, and categories of the movies. We may check some of the feature’s unique value counts. For instance, on Netflix, we have 72 different movie and series types.
(len(df.listed_in.str.split(',').explode().unique()))
OUTPUT>>>
72- We have taken the “listed_in” column from our “df” data frame.
- We have turned it into a string with the “str()” method.
- We have split the values with “,” delimiter.
- We have taken all the split values into a time series with the index numbers via the “explode()” method.
- We have extracted only the unique values with “unique()”.
- We have taken the length of our created data series.
This means that we have 72 different movie and series types, as a beginning we can create a word cloud from our movie types.
Creating a Word Cloud with Python: First Instance
To create a Word Cloud with Python, we have imported the WordCloud library and the “WordCloud” function from it. To understand and use any type of function in Python, you can use the “?Function_name” command as below.
?WordCloud

OUTPUT>>>

Init signature:
WordCloud(
    font_path=None,
    width=400,
    height=200,
    margin=2,
    ranks_only=None,
    prefer_horizontal=0.9,
    mask=None,
    scale=1,
    color_func=None,
    max_words=200,
    min_font_size=4,
    stopwords=None,
    random_state=None,
    background_color='black',
    max_font_size=None,
    font_step=1,
    mode='RGB',
    relative_scaling='auto',
    regexp=None,
    collocations=True,
    colormap=None,
    normalize_plurals=True,
    contour_width=0,
    contour_color='black',
    repeat=False,
    include_numbers=False,
    min_word_length=0,
    collocation_threshold=30,
)
Docstring:
Word cloud object for generating and drawing.

Parameters
----------
font_path : string
    Font path to the font that will be used (OTF or TTF).
    Defaults to DroidSansMono path on a Linux machine. If you are on
    another OS or don't have this font, you need to adjust this path.

width : int (default=400)
    Width of the canvas.

height : int (default=200)
    Height of the canvas.

prefer_horizontal : float (default=0.90)
    The ratio of times to try horizontal fitting as opposed to vertical.
    If prefer_horizontal < 1, the algorithm will try rotating the word
    if it doesn't fit. (There is currently no built-in way to get only
    vertical words.)

mask : nd-array or None (default=None)
    If not None, gives a binary mask on where to draw words. If mask is not
    None, width and height will be ignored and the shape of mask will be
    used instead. All white (#FF or #FFFFFF) entries will be considerd
    "masked out" while other entries will be free to draw on. [This
    changed in the most recent version!]

contour_width: float (default=0)
    If mask is not None and contour_width > 0, draw the mask contour.

contour_color: color value (default="black")
    Mask contour color.

scale : float (default=1)
    Scaling between computation and drawing. For large word-cloud images,
    using scale instead of larger canvas size is significantly faster, but
    might lead to a coarser fit for the words.

min_font_size : int (default=4)
    Smallest font size to use. Will stop when there is no more room in this
    size.

font_step : int (default=1)
    Step size for the font. font_step > 1 might speed up computation but
    give a worse fit.

max_words : number (default=200)
    The maximum number of words.

stopwords : set of strings or None
    The words that will be eliminated. If None, the build-in STOPWORDS
    list will be used. Ignored if using generate_from_frequencies.

background_color : color value (default="black")
    Background color for the word cloud image.

max_font_size : int or None (default=None)
    Maximum font size for the largest word. If None, height of the image is
    used.

mode : string (default="RGB")
    Transparent background will be generated when mode is "RGBA" and
    background_color is None.

relative_scaling : float (default='auto')
    Importance of relative word frequencies for font-size.  With
    relative_scaling=0, only word-ranks are considered.  With
    relative_scaling=1, a word that is twice as frequent will have twice
    the size.  If you want to consider the word frequencies and not only
    their rank, relative_scaling around .5 often looks good.
    If 'auto' it will be set to 0.5 unless repeat is true, in which
    case it will be set to 0.

    .. versionchanged: 2.0
        Default is now 'auto'.

color_func : callable, default=None
    Callable with parameters word, font_size, position, orientation,
    font_path, random_state that returns a PIL color for each word.
    Overwrites "colormap".
    See colormap for specifying a matplotlib colormap instead.
    To create a word cloud with a single color, use
    ``color_func=lambda *args, **kwargs: "white"``.
    The single color can also be specified using RGB code. For example
    ``color_func=lambda *args, **kwargs: (255,0,0)`` sets color to red.

regexp : string or None (optional)
    Regular expression to split the input text into tokens in process_text.
    If None is specified, ``r"\w[\w']+"`` is used. Ignored if using
    generate_from_frequencies.

collocations : bool, default=True
    Whether to include collocations (bigrams) of two words. Ignored if using
    generate_from_frequencies.


    .. versionadded: 2.0

colormap : string or matplotlib colormap, default="viridis"
    Matplotlib colormap to randomly draw colors from for each word.
    Ignored if "color_func" is specified.

    .. versionadded: 2.0

normalize_plurals : bool, default=True
    Whether to remove trailing 's' from words. If True and a word
    appears with and without a trailing 's', the one with trailing 's'
    is removed and its counts are added to the version without
    trailing 's' -- unless the word ends with 'ss'. Ignored if using
    generate_from_frequencies.

repeat : bool, default=False
    Whether to repeat words and phrases until max_words or min_font_size
    is reached.

include_numbers : bool, default=False
    Whether to include numbers as phrases or not.

min_word_length : int, default=0
    Minimum number of letters a word must have to be included.

collocation_threshold: int, default=30
    Bigrams must have a Dunning likelihood collocation score greater than this
    parameter to be counted as bigrams. Default of 30 is arbitrary.

    See Manning, C.D., Manning, C.D. and Schütze, H., 1999. Foundations of
    Statistical Natural Language Processing. MIT press, p. 162
    https://nlp.stanford.edu/fsnlp/promo/colloc.pdf#page=22

Attributes
----------
``words_`` : dict of string to float
    Word tokens with associated frequency.

    .. versionchanged: 2.0
        ``words_`` is now a dictionary

``layout_`` : list of tuples (string, int, (int, int), int, color))
    Encodes the fitted word cloud. Encodes for each word the string, font
    size, position, orientation and color.

Notes
-----
Larger canvases with make the code significantly slower. If you need a
large word cloud, try a lower canvas size, and set the scale parameter.

The algorithm might give more weight to the ranking of the words
than their actual frequencies, depending on the ``max_font_size`` and the
scaling heuristic.
File:           c:\python38\lib\site-packages\wordcloud\wordcloud.py
Type:           type
Subclasses:
Thanks to the question mark before the function name, we can see all of the parameters, examples, and definitions for a Python command. We see that most of the parameters that “WordCloud” has been about the “visualization of the word cloud” such as margin, height, width, and more. First, we will create a word cloud from the first description of our Data Frame.
df[:1]You may see the output below.

Our movie is “Norm of the Nort: King Sized Adventure”. And the description of this movie is below.
df[:1]['description']You may see the result below.

Since, our result has been truncated because of its length, we also can use “pd.option_context” via Pandas.
with pd.option_contexxt('max_colwidth', None):
    print(df.description[:1])
You may see the result below.

Now, we have all of the words in the description example so that we can compare them with our example of the word cloud. To create a word cloud with Python, the necessary codes are below.
text = df.description[0]
wordcloud = WordCloud().generate(text)
plt.imshow(wordcloud, interpolation='bilinear')
plt.axis("off")
plt.figure(figsize=(10,10))
plt.show()- Before showing the result, let’s explain the code lines here.
- We have assigned our description to the “text” variable.
- We have created a “Word Cloud” object with the “WordCloud()” and “generate()” function and method, assigned it into the “wordcloud” variable.
- We have turned off the axis via “matplotlib”.
- We have changed the size of the plot via “plt.figure(figsize=(Number, Number))”.
- We have called our plot.
You may see the result below.
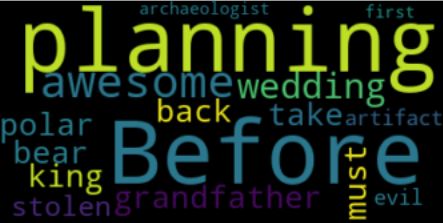
We have created a word cloud from our related description. This is just a basic example of the use case of word clouds. We see that our first description talks about the terms “wedding”, “planning”, “take”, “back”. With the biggest words in the word cloud, you may understand the theme of the description and the word cloud that has been created from it.
Changing the Font-size, Max Words, and Background Color of Word Clouds in Python
After creating a word cloud in Python, we also can change the design of the word cloud. You may see some of the examples below.
wordcloud = WordCloud(max_font_size=45, max_words=10, background_color="#e5e5e5").generate(text)
plt.figure()
plt.imshow(wordcloud, interpolation="bilinear", alpha=0.8, aspect="equal")
plt.axis("off")
plt.show()
In the code example above, we have changed the font size of the words that can have maximum, we have limited the number of words until 10, we have changed the background color to “e5e5e5”. Also, we have used “plt.imshow()” method for interpolation, alpha, and aspect ratio configuration. Alpha is for the opacity of the words while aspect is for the width and height percentages of the values. Interpolation is also for making the image more smooth and aesthetic for reading. You may see the result below.
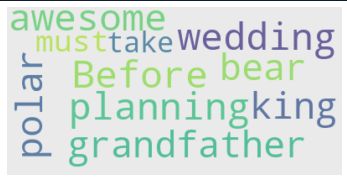
You may check whether the word cloud image has the features that we have determined or not.
How to Create an Output File from Word Cloud in Python
To take an output file from the word cloud design we have used before, we will use the “to_file(“file path”)” method. You may see an example of taking a word cloud output file as an image below.
wordcloud.to_file("first_output.png")
OUTPUT>>>
<wordcloud.wordcloud.WordCloud at 0x1eb1f11f3a0>
You may see the result below.

On the left side of the image above, you will see the output in the VSCode Folder, at the right side, you will see the output file in the windows folder. At below, you will see the image itself.
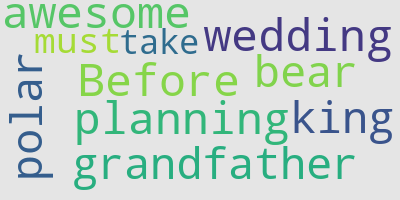
This was an example of a single sentence, now we can create a bigger word cloud example the words are used in the movie and series titles in Netflix.
How to Create a Word Cloud from Data Frame’s Columns in Python
To create a word cloud from a data frame’s column (data series), we need to unite all of the data cells’ values in the given column. We can do this with the string join method. The string join method is using the “join()” function with the list comprehension as below.
titles = " ".join(review for review in df.description)
print ("There are {} words in the combination of all titles in the Netflix Data Frame.".format(len(titles)))

OUTPUT>>>

"There are 115358 words in the combination of all titles in the Netflix Data Frame."
In the example above, we have united all the words in the title column of the data frame and there are 115358 words that are being used in Netflix’s movies and series data frame. We also can see the most used words in a data series as below.
from nltk.corpus import stopwords
stop = stopwords.words('english')
#stop.append("The")
#stop.append("A")
#stop.append("&")
print(stop)

OUTPUT>>>
['i', 'me', 'my', 'myself', 'we', 'our', 'ours', 'ourselves', 'you', "you're", "you've", "you'll", "you'd", 'your', 'yours', 'yourself', 'yourselves', 'he', 'him', 'his', 'himself', 'she', "she's", 'her', 'hers', 'herself', 'it', "it's", 'its', 'itself', 'they', 'them', 'their', 'theirs', 'themselves', 'what', 'which', 'who', 'whom', 'this', 'that', "that'll", 'these', 'those', 'am', 'is', 'are', 'was', 'were', 'be', 'been', 'being', 'have', 'has', 'had', 'having', 'do', 'does', 'did', 'doing', 'a', 'an', 'the', 'and', 'but', 'if', 'or', 'because', 'as', 'until', 'while', 'of', 'at', 'by', 'for', 'with', 'about', 'against', 'between', 'into', 'through', 'during', 'before', 'after', 'above', 'below', 'to', 'from', 'up', 'down', 'in', 'out', 'on', 'off', 'over', 'under', 'again', 'further', 'then', 'once', 'here', 'there', 'when', 'where', 'why', 'how', 'all', 'any', 'both', 'each', 'few', 'more', 'most', 'other', 'some', 'such', 'no', 'nor', 'not', 'only', 'own', 'same', 'so', 'than', 'too', 'very', 's', 't', 'can', 'will', 'just', 'don', "don't", 'should', "should've", 'now', 'd', 'll', 'm', 'o', 're', 've', 'y', 'ain', 'aren', "aren't", 'couldn', "couldn't", 'didn', "didn't", 'doesn', "doesn't", 'hadn', "hadn't", 'hasn', "hasn't", 'haven', "haven't", 'isn', "isn't", 'ma', 'mightn', "mightn't", 'mustn', "mustn't", 'needn', "needn't", 'shan', "shan't", 'shouldn', "shouldn't", 'wasn', "wasn't", 'weren', "weren't", 'won', "won't", 'wouldn', "wouldn't"]

###Continues the script.
titles = df.title.str.split(',').explode().str.split(' ').explode()
df['title_words'] = df.title.apply(lambda x: [item for item in x.split() if item not in stop])
df.title_words.explode().value_counts().to_frame().head(50).style.background_gradient('viridis')
Explanation of the code block above is below in a list format, as step by step.
- We have imported the “stopwords” from the NLTK Python Library.
- We have chosen the English Stop Words. (As a note, we also have some non-English titles in our data frame.)
- We have assigned the stop words list into a variable that is “stop”.
- We have appended some other stop words into our list that is “The”, “A”, or “&” sign. But, we have commented on them so that adding them can be optional.
- We have printed our stop words.
- We have created a new variable that is “titles” and we have split our values with the “,” sign, and then we have also split them with the spaces between words.
- We have created a new column that is “title_words”.
- We have used the “apply” method along with a “lambda function” to append the words only that are not in our stop words list.
- We have used “value_counts()” to count the most used words, we have turned our output into a frame, called the first 50 results, and used the “viridis” colormap as background for our data frame output.
You may see the result below.

Since I didn’t exclude the “The” word, it is at the top. We also see that we have “life”, “world”, “christmas”, “time”, “black”, “American” and the German “de” word in our list. Now, let’s create our word cloud.
“To calculate the weighted and absolute frequency of the words in a document and data frame with Python” you can read the related guideline.
stopwords = set(STOPWORDS)
wordcloud = WordCloud(stopwords=stopwords, background_color="white").generate(text)
plt.axis("off")
plt.tight_layout(pad=0)
plt.imshow(wordcloud, interpolation='bilinear')
plt.figure( figsize=(5,5), facecolor='k')
plt.show()- We have turned our “STOPWORDS” into a set. At the beginning of our script, we have imported STOPWORDS from the “WordCloud” Python Library.
- We have used “WordCloud” function with “stopwords”, “background_color” parameters and the “generate()” function.
- We have turned the axis off via “plt.axis()”.
- We have used the tight layout and deleted all the padding with “tight_layout()”.
- We have used the “plt.imshow()” with our “word cloud” variable, chose the “bilinear” as an “interpolation” parameter.
- We have changed the figure size and “facecolor” value.
- We have called our word cloud.
You may see the result below.
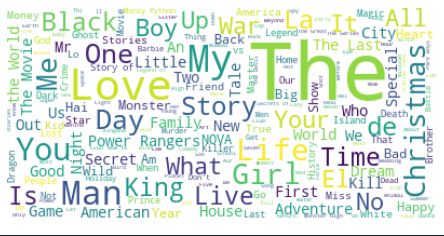
We actually have the same words in the frequency data frame as the biggest words such as “The”, “Love” and “Man”. We also see words such as “Time”, “Life”, “King”, “Girl”, “Me”, “Black”, “War”. Now, we also can create the same word cloud for our movie and series descriptions. So that we can figure out if there any different word methodology or pattern differences for the titles and descriptions in Netflix’s understanding of the artworks.
descriptions = " ".join(review for review in df.description)
print ("There are {} words in the combination of all titles in the Netflix Data Frame.".format(len(titles)))

There are 115358 words in the combination of all titles in the Netflix Data Frame.

stopwords = set(STOPWORDS)
wordcloud = WordCloud(stopwords=stopwords, background_color="white").generate(descriptions)
plt.axis("off")
plt.tight_layout(pad=0)
plt.imshow(wordcloud, interpolation='bilinear')
plt.figure( figsize=(5,5), facecolor='k')
plt.show()
You may see the result below.
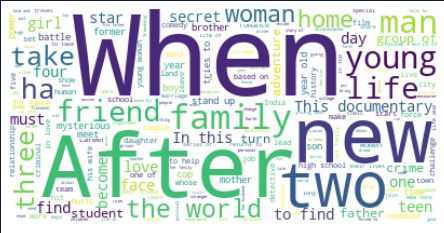
We see that Netflix uses “after”, “when” words, and various numbers in their movie and artwork descriptions for describing the scenarios and topics. Also, there are some mutual words such as “family”, “woman”, “friend”. Also, we see words such as “secret”, “group of”, “this documentary”, “adventure” words that can be definitive or curios triggers.
Lastly, we also can create word clouds in the shape of different logos, icons and also we can use these images’ color schemes in our Word Clouds via Python, thanks to “Numpy”.
How to Create Word Clouds with the Different Images’ Shapes with Python
To create word clouds with Python in the shapes of different images, logos, and their color schemes, Numpy can be used. Since, in this tutorial we have used Netflix’s Movie and Series Data Set, we also can use Netflix’s logo for the same purpose. Below, you will see a simple example for finding suitable images for word clouds in Python along with changing the color structure of images with Numpy for word cloud creation.
How an Image Should be for WordClouds in Python?
To create a word cloud with the shape of an image, you should find an image that is suitable to be a mask for word clouds. A maskable image should include “255” values for the “pure white” color within them. To find maskable images, you can search for “WordCloud Mask Images” in Google, Yandex, Bing, or other Search Engines to find a suitable example. If an image doesn’t include “255” values for pure white, you should use “Numpy” for turning “0” values to “255”. So, an image can be used for masking purposes within a word cloud.
A Word Cloud Building Example with Maskable Images
Below, you will see an example for a word cloud with the shape of a heart image with the content of the Search Engine Optimization page of Wikipedia.
First, we need to import “Wikipedia” module for Python along with the “re” module for cleaning the text for word cloud creation.
import wikipedia
import re
wiki = wikipedia.page('Search Engine Optimization')
text = wiki.content
text = re.sub(r'==.*?==+', '', text)
text = text.replace('\n', '')
You may see the explanation of the lines in the code block below.
- At the first line of the code block, we have imported Wikipedia which is the Wikipedia Module of Python.
- At the second line of the code block, we have imported the “re” which is the Regex Module of Python.
- In the third line of the code block, we have created a variable which is a wiki and we have used the “page()” method for reaching the “Search Engine Optimization” page of Wikipedia.
- In the fourth line of the code block, we have assigned the content of the SEO Page of Wikipedia to the “text” variable.
- In the fifth line of the code block, we have used “re.sub()” method to change the “punctuation” characters and new line characters with an empty character so that our word cloud can be clearer for us.
After we have prepared the content for the word cloud creation with Python, we need to prepare our mask image.
mask = np.array(Image.open("seo.jpg"))
mask

OUTPUT>>>
rray([[255, 255, 255, ..., 255, 255, 255],
       [255, 255, 255, ..., 255, 255, 255],
       [255, 255, 255, ..., 255, 255, 255],
       ...,
       [255, 255, 255, ..., 255, 255, 255],
       [255, 255, 255, ..., 255, 255, 255],
       [255, 255, 255, ..., 255, 255, 255]], dtype=uint8)
With the “mask” variable, we have opened “seo.jpg” which is a maskable image for word clouds from Google Image Search. Since this image is already ready for being used as a mask within our word cloud, we do not need to focus on “0” and “255” values within it via Numpy. And also, as you can see that when we call our image, we see that it has “255” values as “pure white”. And, below you will see the original shape of our word cloud mask image.

Below, you will see our word cloud making code block.
wordcloud = WordCloud(width = 3000, height = 2000, random_state=1, background_color='white', colormap='Set2', collocations=False, stopwords = STOPWORDS, mask=mask).generate(text)
- With the code block above, we have created a variable with the name “word cloud”.
- We have used the “mask” parameter with our “WordCloud” function and maskable image which is “seo.jpg”
- “Collocations=False” parameter and value mean that do not include the biagrams.
- “random_state” is for recoloring the word cloud with the PIL color.
- With the help of the “generate(text)” method, we have used “Search Engine Optimization Wikipedia Page’s content” for our word cloud without the stopwords from “NLTK.STOPWORDS”.
After building wordcloud, below you will see how to plot a word cloud with mask via matplotlib.
plt.figure(figsize=(10,10), facecolor="k")
plt.axis("off")
plt.tight_layout(pad=0)
plt.imshow(wordcloud, interpolation='bilinear')
plt.show()
wordcloud.to_file("seo-wordcloud.jpg")- We have determined the figure size and face color with the first line of the code block above.
- We have set the axis off with the second line of the word cloud plotting code block.
- We have used tight layout with “plt.tight_layout()”.
- We have used “plt.imshow()” for showing our word cloud.
- We also used the “to_file()” function to save our word cloud to an image.
Below, you will see the “Wikipedia’s Search Engine Optimization Content” within a word cloud with the borders of a heart image which means love.

A Word Cloud Making Example with the Logo of a Brand
After showing how to create a word cloud with a maskable image, we can use the “Netflix” logo to create a word cloud. But, since Netflix Logo is not suitable to be a word cloud mask, we need to optimize its pixels and colors to be used in a word cloud. Below, you will see the original shape of a Netflix Logo and also its “Numpy Array Values”.

Below, you will see the Netflix Logo’s color values within a Numpy Array.
mask = np.array(Image.open("netflix.png"))
mask

OUTPUT>>>

array([[0, 0, 0, ..., 0, 0, 0],
       [0, 0, 0, ..., 0, 0, 0],
       [0, 0, 0, ..., 0, 0, 0],
       ...,
       [0, 0, 0, ..., 0, 0, 0],
       [0, 0, 0, ..., 0, 0, 0],
       [0, 0, 0, ..., 0, 0, 0]], dtype=uint8)
As you may notice, it is full of “0” values for the “white” color. “255” means pure white while “1” means “black”. To use this image as a word cloud mask, we need to turn “0” values to “255”. First, we will create a custom function for turning “zeros” to “255”s.
def transform_zeros(val):
    if val == 0:
        return 255
    else:
        return val
The “transform_zeros” function takes the “val” which is equal to “0”, and return a “255” instead of it. Below, we will create a “maskable_image” variable with the help of the “np.ndarray” function.
maskable_image = np.ndarray((mask.shape[0],mask.shape[1]), np.int32)
We have created a new “multi-dimensional ndarray” with the help of “np.ndarray” function with the data type of “np.int32”.
for i in range(len(mask)):
    maskable_image[i] = list(map(transform_zeros, mask[i]))
We have used a for loop to use the “transform_zeros” function for every value of “maskable_image” nd.array’s. Below, you will see how every “0” value turned into a “255” as pure white.
maskable_image

OUTPUT>>>
array([[255, 255, 255, ..., 255, 255, 255],
       [255, 255, 255, ..., 255, 255, 255],
       [255, 255, 255, ..., 255, 255, 255],
       ...,
       [255, 255, 255, ..., 255, 255, 255],
       [255, 255, 255, ..., 255, 255, 255],
       [255, 255, 255, ..., 255, 255, 255]])
Now, since our Netflix Logo is ready to be a word cloud mask, we can use it with the WordCloud function and “mask” parameter as in the code block below.
wordcloud = WordCloud(width = 3000, height = 2000, random_state=1, background_color='white', colormap='Set2', collocations=False, stopwords = STOPWORDS, mask=maskable_image).generate(text)

def plot_cloud(wordcloud):
    # Set figure size
    plt.figure(figsize=(40, 30))
    # Display image
    plt.imshow(wordcloud)
    # No axis details
    plt.axis("off");
plot_cloud(wordcloud)
We have just changed the “mask” parameter value as “maskable_image” so that our mask image change. You can see the word cloud output below.
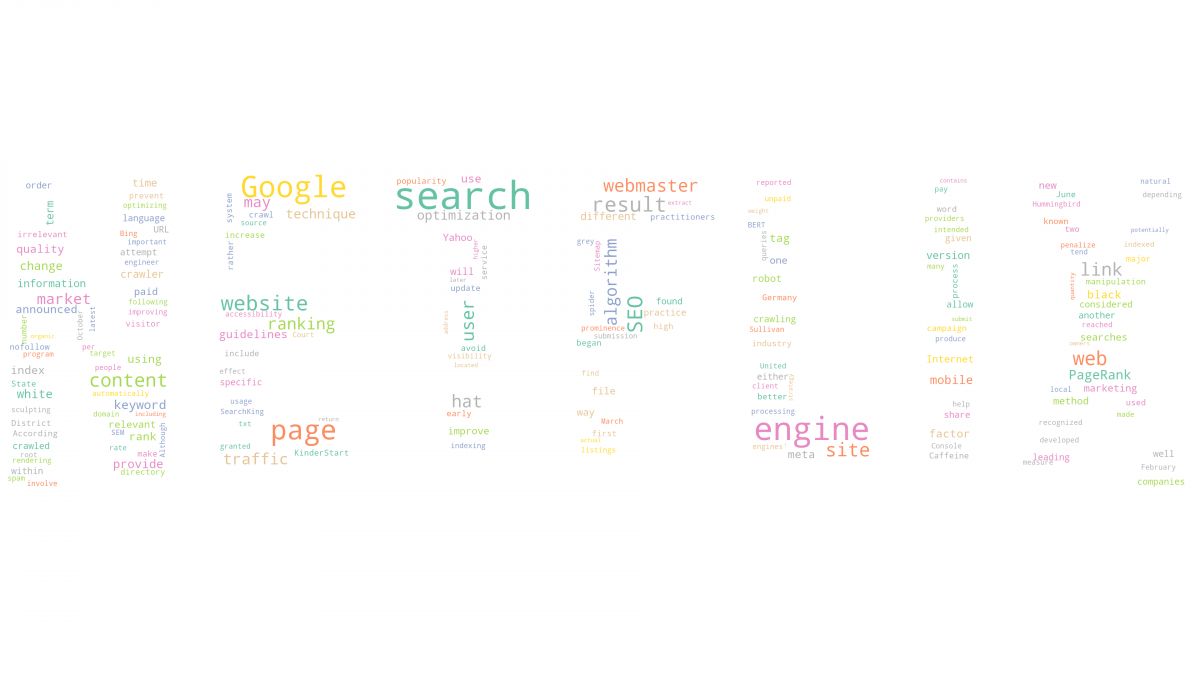
As you can see that we have used Netflix Logo for our word cloud. But, there are two things to notice here. First, our mask image is too large for our text, that’s why some letters within the mask image are not evident as it should be. Second, we have used Wikipedia’s SEO Page’s content for establishing our word cloud with the Netflix Logo. But, we should have used the Netflix Movies and Series names. So, let’s try one more time.
Code block for creating word wloud with the Netflix Logo and Netflix Movies and series titles can be seen below.
titles = " ".join(title for title in df.title)

wordcloud = WordCloud(width = 3000, height = 2000, random_state=1, background_color='white', colormap='Set2', collocations=False, stopwords = STOPWORDS, mask=maskable_image).generate(titles)

def plot_cloud(wordcloud):
    # Adjust the figure size
    plt.figure(figsize=(40, 30))
    # Display the word cloud
    plt.imshow(wordcloud)
    # Remove the axis details and names
    plt.axis("off");
plot_cloud(wordcloud)
wordcloud.to_file("netflix-wordcloud.png")
We have created a new variable with the name of “title” and used the “join” method to merge every title of the Netflix Movies and Series. You can see word cloud output with the titles of Netflix Movies and Series with Netflix Logo shape below.
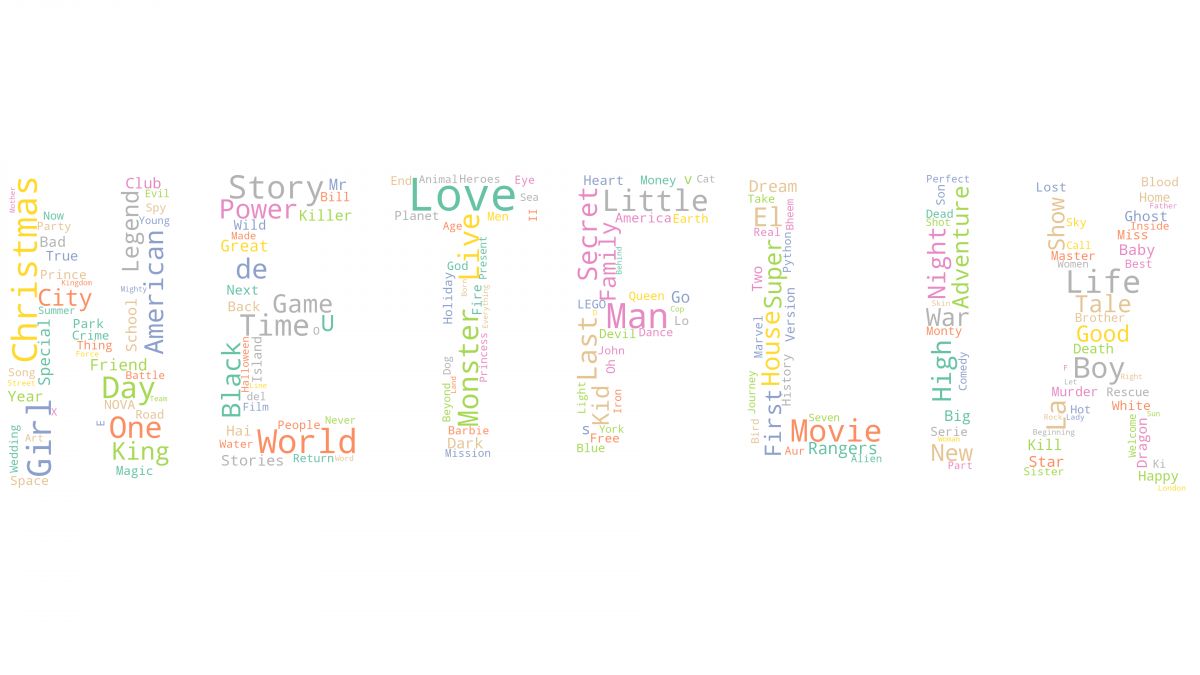
As you can see, since our “text” is longer, the letters of the Word Cloud is more concrete and evident than before. Also, we clearly see which words and concepts are being used more within Netflix Movie and Series titles. Below, you will see an example for also Netflix Movie and Series descriptions as a word cloud.
descriptions = " ".join(description for description in df.description)

wordcloud = WordCloud(width=3000, height=2000, random_state=1, colormap="Set2",mask=maskable_image, stopwords=stopwords, background_color="white", collocations=False ).generate(descriptions)


plt.figure(figsize=(10,10), facecolor="k")
plt.axis("off")
plt.tight_layout(pad=0)
plt.imshow(wordcloud, interpolation='bilinear')
wordcloud.to_file("netflix-wordcloud.png")
We have created a new variable with the name of “descriptions” to join every description of every movie and series from Netflix as we did before for titles of Netflix creations. Below, you can see the result for word cloud design with the descriptions of Netflix artworks within the shape of Netflix Logo.
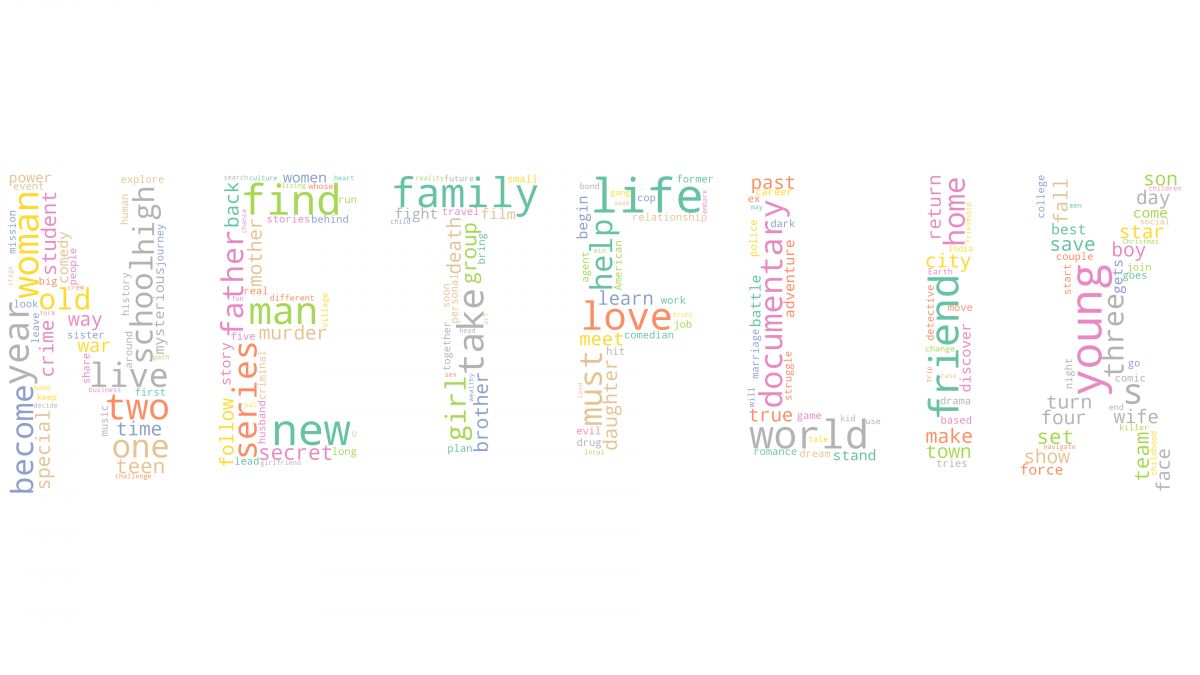
You also can compare the word clouds of Netflix artworks’ titles and descriptions to understand their perspective differences or how do they summary topics of artworks along with what they focus on more.
How to Use Word Clouds for Holistic SEO with Python
Word Clouds also can be useful for Holistic SEO Projects. With Python and the packages and libraries that are being used by us in this word cloud guideline with Python such as Numpy, Pillow, Pandas, Matplotlib, Wordcloud, NLTK, we also can create insights for a website’s different aspects. With Advertools, you can crawl a website and extract all the meta titles, descriptions, and anchor texts to create from them a word cloud. Or, you can scrape Google Search Engine Results Page and you can create a word cloud from the first 100 results’ meta titles for a given query. For instance, you will see “Holisticseo.digital” meta titles in a word cloud.
import advertools as adv
adv.crawl('https://www.holisticseo.digital', "holisticseo.jl", follow_links=True)
df_hs = pd.read_json('holisticseo.jl', lines=True)
titles_hs = " ".join(word for word in df_hs['title'])
wordcloud_hs = WordCloud(stopwords=stopwords, background_color="white").generate(titles_hs)
plt.tight_layout(pad=0)
plt.axis('off')
plt.imshow(wordcloud_hs, interpolation="bilinear")
plt.figure(figsize=[20,10], facecolor='k')
plt.show()- In the first line, we have imported the Advertools as “adv”.
- We have crawled the “holisticseo.digital” address and take an output file as the name “holisticseo.jl”.
- We have used “pd.read_json” to read our output file.
- We have extracted all the meta titles and gathered them up in a single variable in the string format.
- We have used the “WordCloud” function and Matplotlib as “plt” for creating our word cloud.
You may see the Holistic SEO & Digital’s meta title strategy below.
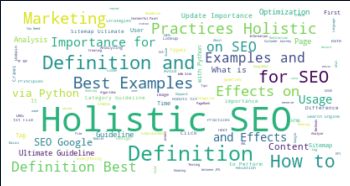
Since Holistic SEO & Digital uses Semantic Search and Semantic SEO Principles and Understanding, we see a pattern in our meta titles such as “Best Examples”, “Definition”, “via Python”, “Effects”, “How to”, “Practices”, “Optimization” and “Importance”. Those words are being used for different types of content in a semantic categorization for different types of search intent. If you are an SEO, you may compare the different web sites’ meta tags within a word cloud to understand their character in a better perspective.
- To learn more about “Crawling a Web Site with Python and Advertools” you can read our related guidelines.
- If you wonder how to scrape Google SERP and extract the results’ meta tags and URLs via Python, you can read our related guidelines.
Why Word Clouds Shouldn’t be used as Definitive Insight Extracting Methodology?
Word Clouds shouldn’t be used for Data Science or extracting precise insights. It is a quicker way to visualize the frequency and importance of terms with visualization. But, since the words with more letters will cover more space, they might mislead you to think that the “long words” have more importance than the shorter words. Thus, word clouds should be used as a quick visualization, presentation, and general observation methodology instead of precise and definitive conclusions.
Last Thoughts on Word Clouds, Data Science, SEO and Analytical Thinking Relations
Word Clouds are a visualization of patterns and mindsets of different entities. In a data frame and specific columns, you may understand the most frequently used words with a visualization. Also, using Word Clouds with different types of Images and their Color Schemes thanks to Pillow and Numpy can create better visualizations and triggers for human beings. For a brand, using its brand logo for the most used words in movie titles or the customer reviews can create a better connotation for the active mindset. Comparing different word clouds that are related to the same topic also can create better awareness for the related people to take action. SEO and Data Science will have more and more common points in time and Word Clouds are just one of those points. You can use them for brief summaries in an artful way or you can create more depth images for comparative analysis.
Our Word Cloud Creation with Python for Analysing Data Guideline will be continued to be updated by time in the light of new information and methodologies.
- Sliding Window - August 12, 2024
- B2P Marketing: How it Works, Benefits, and Strategies - April 26, 2024
- SEO for Casino Websites: A SEO Case Study for the Bet and Gamble Industry - February 5, 2024


